How Much Time Do You Actually Spend on Your Phone?
By Dom · · 9 min read
The weekly notification arrives on a Sunday morning, which is its own small joke. Screen Time: your average was up 14% last week. You look at the number for about two seconds, feel something unpleasant, and swipe it away without opening the report.
That two seconds is the whole problem, and it is not a willpower problem. You cannot act on a number you refuse to look at, and you cannot look at a number that arrives framed as a verdict. So here is the version without the verdict: what the data actually says, why your own estimate is probably wrong in a specific and interesting way, and how to find your real figure.
Key takeaways
- Be sceptical of the big round averages. The widely quoted "4 hours 37 minutes" style figures usually come from commercial analytics panels, not probability samples, and different providers disagree by hours.
- What is well measured: Pew finds 91% of US adults own a smartphone and 41% say they are online "almost constantly" — rising to 63% of adults aged 18 to 29.
- Your guess is unreliable in a specific direction. In one study that compared self-reports against phone logs, people overestimated their hours while every single participant underestimated notifications.
- The perception is what tracks distress. In that same study, perceived usage predicted problematic-use scores; measured screen time did not.
- Your own number takes 30 seconds to find — Settings › Screen Time on iPhone, Settings › Digital Wellbeing on Android — and it beats every average you will ever read.
Why "the average" is shakier than it looks
Search this question and you will be handed a confident figure: four hours thirty-seven minutes, or five hours sixteen, or seven hours four. They are quoted to the minute, which makes them feel measured.
Most of them come from commercial analytics firms that estimate usage from panels of consenting users or from app-install data. That is a legitimate way to build a market estimate. It is not a random sample of a population, the panels differ, the definitions differ — does "screen time" include the podcast playing while you drive? — and the results consequently differ by hours. When two sources disagree by 40% and both are quoted to the minute, the precision is not real.
So it is worth separating what is genuinely well measured from what is a market estimate.
What the reliable data actually says
Pew Research Center runs probability-based surveys with published methodology, which makes them the better anchor even though they ask about frequency rather than hours.
In its survey of 5,022 US adults conducted February 5 to June 18, 2025 (margin of error ±1.9 points), Pew found that nine in ten US adults use the internet daily, and 41% say they are online "almost constantly." That share is not evenly spread:
| Age group | Online almost constantly |
|---|---|
| 18–29 | 63% |
| 30–49 | 54% |
| 50–64 | 33% |
| 65+ | 14% |
The same survey programme puts smartphone ownership at 91% of US adults, and 97% among 18- to 29-year-olds. Note what this is and is not: "almost constantly" is a self-description, not a stopwatch. Which turns out to matter more than you would expect.
The study that measured both
A 2026 study in Frontiers in Computer Science did something most surveys do not: it asked people to estimate their usage and then pulled the actual figures off their phones.
Researchers surveyed 73 Italian first-year high school students (mean age 14.7, 63% male) and compared their self-reports against the logs from Digital Wellbeing on Android and Screen Time on iOS. Objectively, the group averaged 5 hours 36 minutes a day, roughly 184 notifications, and about 98 screen unlocks.
Two findings are worth sitting with:
- The direction of error was not what you would guess. The majority overestimated their daily hours. But on notifications the error ran the other way and ran hard — all 73 participants underestimated how many they received.
- Perception predicted distress; measurement did not. Perceived usage time was significantly associated with problematic-use scores, while objective screen time was not.
Scope matters here, so state it plainly: this is 73 adolescents in one country, cross-sectional, and it cannot be generalised to adults or to the US. It is one careful study, not a settled fact. But it points at something the big averages cannot: the number in your head and the number on your phone are different numbers, and the one in your head is the one doing the emotional work.
The figure nobody guesses: interruptions
Hours are the wrong unit anyway. Ninety minutes of reading on a phone is not four hours of a feed, and neither is 98 separate interruptions of whatever you were doing.
That is the number the students missed by the widest margin, and it is the one most connected to how a day actually feels. A day carved into a hundred pieces is exhausting in a way that its total does not explain, which is the argument in why screen time is a spiritual problem rather than a productivity one. Common Sense Media has tracked the broader picture for young people for years, and the persistent theme across that work is fragmentation rather than sheer volume.
So when you go looking for your own figure, look at three things, not one: total time, unlocks, and notifications.
Find your real number in 30 seconds
No app required, no sign-up, nothing to install. Both platforms have been logging this the whole time.
- iPhone. Settings › Screen Time › See All App & Website Activity. Switch the tab from Day to Week. Scroll to Pickups and Notifications underneath the time chart.
- Android. Settings › Digital Wellbeing & parental controls › Dashboard. Tap the chart to switch between screen time, unlocks and notifications received.
- Then do the one useful piece of arithmetic. Multiply the daily average by seven. The weekly figure is harder to dismiss than the daily one, and it is the same fact.
Two rules for looking. Take a weekly average, not yesterday — one bad Tuesday is noise. And write your guess down before you open the screen. The gap between your guess and the log is the most informative thing you will learn, and you only get to measure it once.
What to do with the number
Here is where most articles pivot to shame, and shame has a poor record on this. If guilt worked, the Sunday notification would have fixed it years ago.
The useful frame is not "cut down." It is a swap. The feed is not winning because it is better than what you would otherwise do; it is winning because it is nearer. It is one thumb-length away and the alternative is across the room. Reverse the distances and behaviour follows without a fight, which is the practical argument behind putting Scripture before screen time.
Screen time tools give you a timer you can dismiss, and that is the flaw — the thing you are trying to resist is the thing being asked to enforce the rule. BlessUp shields the apps you choose using Apple's own Screen Time system and hands you one specific way through: read the day's chapter. Your phone starts opening the Bible instead of closing it, and the trade takes about nine minutes. BlessUp is on the App Store.
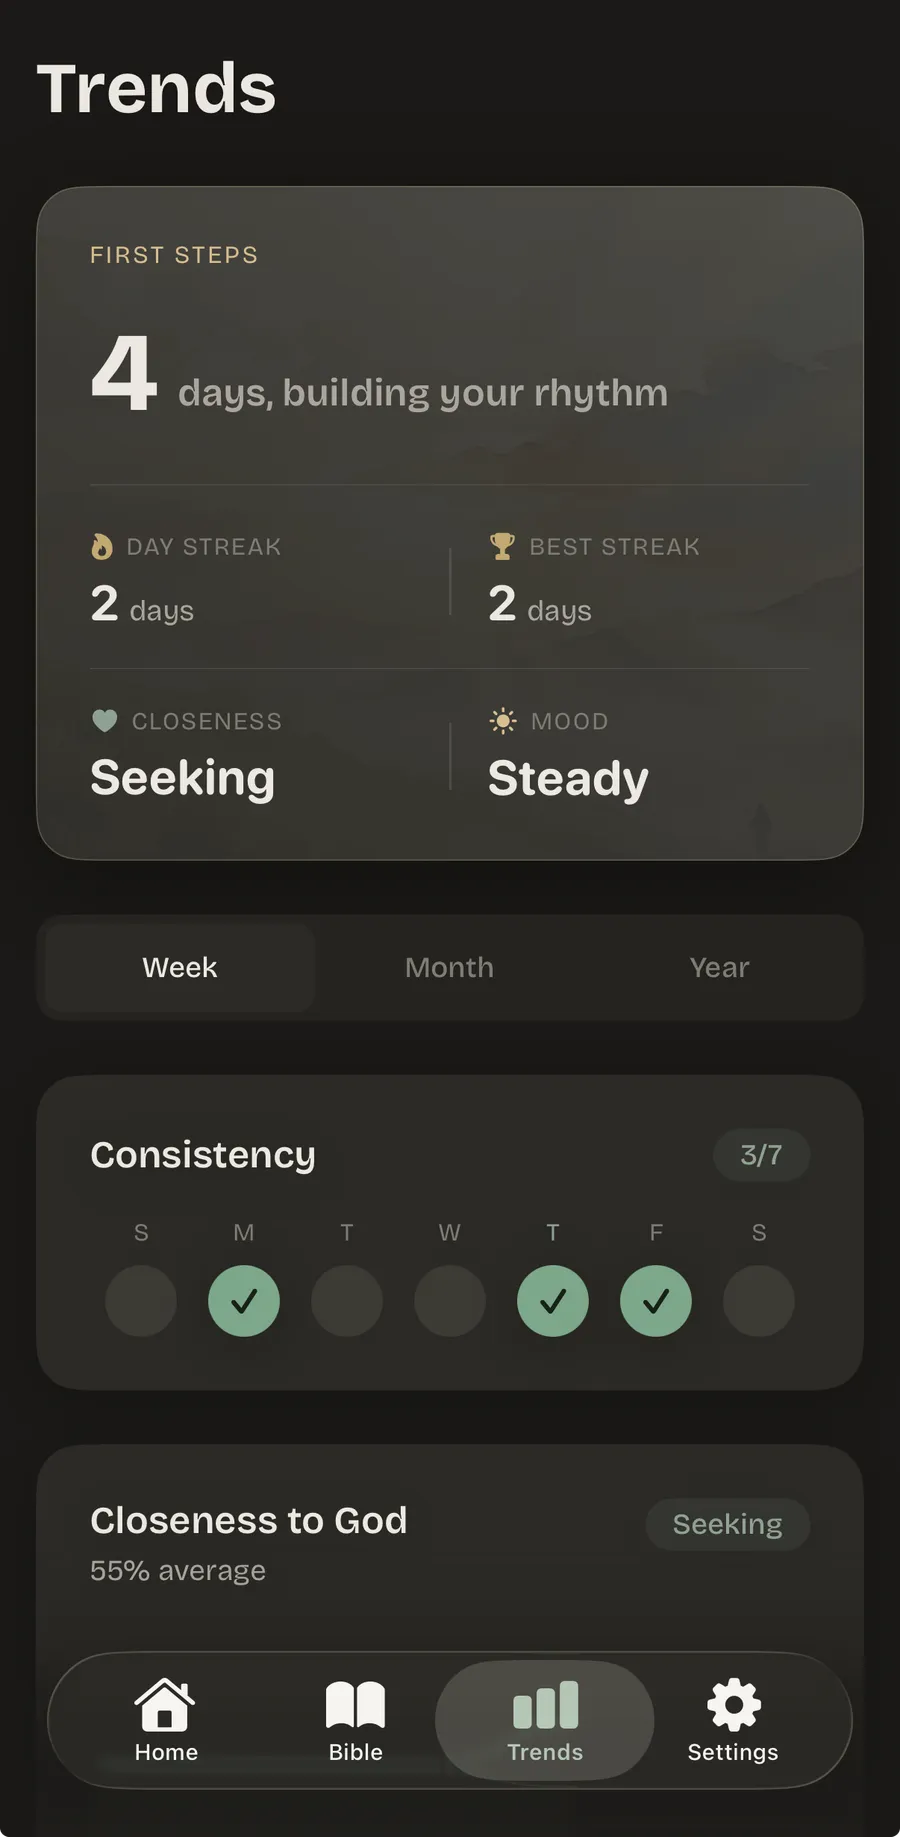
If you want a fuller comparison of what the shielding tools actually do differently, the Christian app blocker roundup covers it, our FAQ answers what the shield can and cannot reach, and Bible Mode explains what the swap looks like in practice.
Numbering the days
There is a verse the app puts at the bottom of its own screen-time report, and it is a better frame than any statistic on this page. Psalm 90:12: "Teach us to number our days, that we may gain a heart of wisdom" (NIV).
Note what it asks for. Not fewer days, and not guilt about the days already spent — the ability to count them clearly. That is a request for accurate measurement, made three thousand years before anyone built a dashboard for it. Ephesians 5:15-16 makes the same move: "Be very careful, then, how you live… making the most of every opportunity."
So look at your number. Not to feel bad about it — it is genuinely just a number, and the average person's is higher than they would like, which makes it unremarkable. Look at it because you cannot trade something away until you know what you are holding.
Frequently asked questions
What is the average screen time per day?
Commonly quoted figures cluster around four to five hours a day, but most come from commercial analytics panels rather than probability samples and they disagree with each other by hours. The better-measured statistic is Pew’s: in a survey of 5,022 US adults conducted February 5 to June 18, 2025, 41% said they are online almost constantly, rising to 63% of those aged 18 to 29.
How do I check my screen time on iPhone?
Open Settings, tap Screen Time, then See All App & Website Activity, and switch the tab from Day to Week. Scroll below the chart for Pickups and Notifications. On Android the equivalent is Settings, then Digital Wellbeing & parental controls, then Dashboard.
Are people accurate about their own screen time?
Generally no. In a 2026 Frontiers in Computer Science study of 73 Italian high school students, the majority overestimated their daily hours, while all 73 underestimated how many notifications they received. Notably, perceived usage was associated with problematic-use scores while objectively logged screen time was not.
Is four hours a day of phone use bad?
The total on its own says very little, because it does not distinguish reading a book from four hours of a feed. Interruptions are the more useful measure: the students in the Frontiers study averaged around 98 unlocks and 184 notifications a day, and that fragmentation explains how a day feels better than the total does.
Does reducing screen time actually require an app?
No. Both iPhone and Android already log usage and offer limits at no cost, and knowing your real weekly figure is most of the value. Apps help when the friction needs to run the other way — when the thing you want to do more of needs to be nearer than the thing you want to do less of.
Your phone can start opening the Bible instead of closing it.
No guilt. Ever. Grace is built in. Funded by readers, never by ads.